Vendor Evaluation Scorecard: Practical Guide for Procurement Teams
Transform vendor selection with our vendor evaluation scorecard guide. Get templates, checklists, and expert tips to streamline procurement today!

A vendor evaluation scorecard is a one-page, weighted rubric that converts subjective vendor impressions into repeatable, auditable scores you can defend to finance, legal, and the C-suite. Build one this week and you'll have a structured basis for every renewal, QBR, and sourcing decision going forward.
What you'll get from this guide:
- A downloadable Excel and Google Sheets template (linked in Section 8)
- A filled sample scorecard with worked calculations
- KPI definitions, formulas, and data sources you can copy directly
- A pilot-to-enterprise rollout checklist with role assignments
- Governance and change management guidance
3-step quick-start checklist:
- Pick 3–5 vendors you need to evaluate this quarter and confirm their contract renewal dates.
- Select 4–6 criteria (quality, delivery, cost, responsiveness, risk, compliance) and assign weights that sum to 100%.
- Run one scoring cycle: collect evidence, score each vendor independently, then moderate as a group.
Pro Tip: You can complete a first scoring cycle for a single vendor within a reasonable timeframe. For a portfolio of vendors, budget a few days including stakeholder alignment.
Table of Contents
- Why procurement teams gain real leverage from vendor scorecards
- How do you convert raw KPI values into a defensible weighted score?
- Where do you get the template, and how do you set it up?
- How do you turn a score into a concrete improvement plan?
- What governance controls make scorecards auditable and defensible?
- What are the most common scorecard mistakes, and how do you avoid them?
- Key Takeaways
- The gap between what scorecards promise and what actually derails them
- Swarm-stack makes scorecard collaboration faster and more defensible
- Authoritative sources and where to read next
Why procurement teams gain real leverage from vendor scorecards
The core benefit is consistency. When every vendor is measured against the same criteria, procurement can defend its decisions to finance, legal, and operations without reconstructing the reasoning from scratch each time. That defensibility matters most at renewal, when a stakeholder pushes back on a price increase or a legal team questions a termination.
HBR research on quantifying wasted time supports the ROI case directly: structured processes reclaim hours lost to interruptions and ad-hoc firefighting. NPR's coverage of interruption costs reinforces the same point. Every unplanned vendor escalation that lands in a category manager's inbox is time that a well-run scorecard cadence would have caught three weeks earlier.
Stakeholder value by role:
| Stakeholder | What they gain | Example metrics they care about |
|---|---|---|
| Procurement / category manager | Consistent data for renewal and sourcing decisions | On-time delivery rate, defect rate, price variance |
| Finance | Spend visibility and cost-performance benchmarking | Invoice accuracy, cost savings vs. benchmark |
| Legal / compliance | Documented evidence for contract enforcement | Compliance score, SLA breach count |
| Operations | Early warning on service degradation | Response time, fill rate, downtime incidents |
| Executive / CPO | Portfolio-level risk view | Watchlist count, strategic vendor tier distribution |
Trend detection is where scorecards pay off beyond the obvious. A vendor whose on-time delivery drops from 96% to 89% over two quarters is signaling a capacity or process problem. Without a scorecard, that drift is invisible until a shipment fails. With one, you have a documented conversation starter six weeks before the crisis.
How do you convert raw KPI values into a defensible weighted score?
Raw percentages from different KPIs are not directly comparable. A 94% on-time delivery rate and a 3.25-hour average response time live on completely different scales. Normalization solves that.
Scoring rubric: 1–5 scale with written anchors
| Score | On-time delivery | Defect rate | Invoice accuracy | Response time |
|---|---|---|---|---|
| 5 (Excellent) | 94% | <0.5% | 96.7% | <2 hours |
| 4 (Good) | 94%–96.7% | 0.5–1% | 94%–96.7% | 2–4 hours |
| 3 (Acceptable) | 90–94% | 1.5–2% | 92–95% | 4–8 hours |
| 2 (At risk) | 85–89% | 3–4% | 88–91% | 8–23 hours |
| 1 (Watchlist) | Below 85% | ≥5% | Below 88% | More than 23 hours |
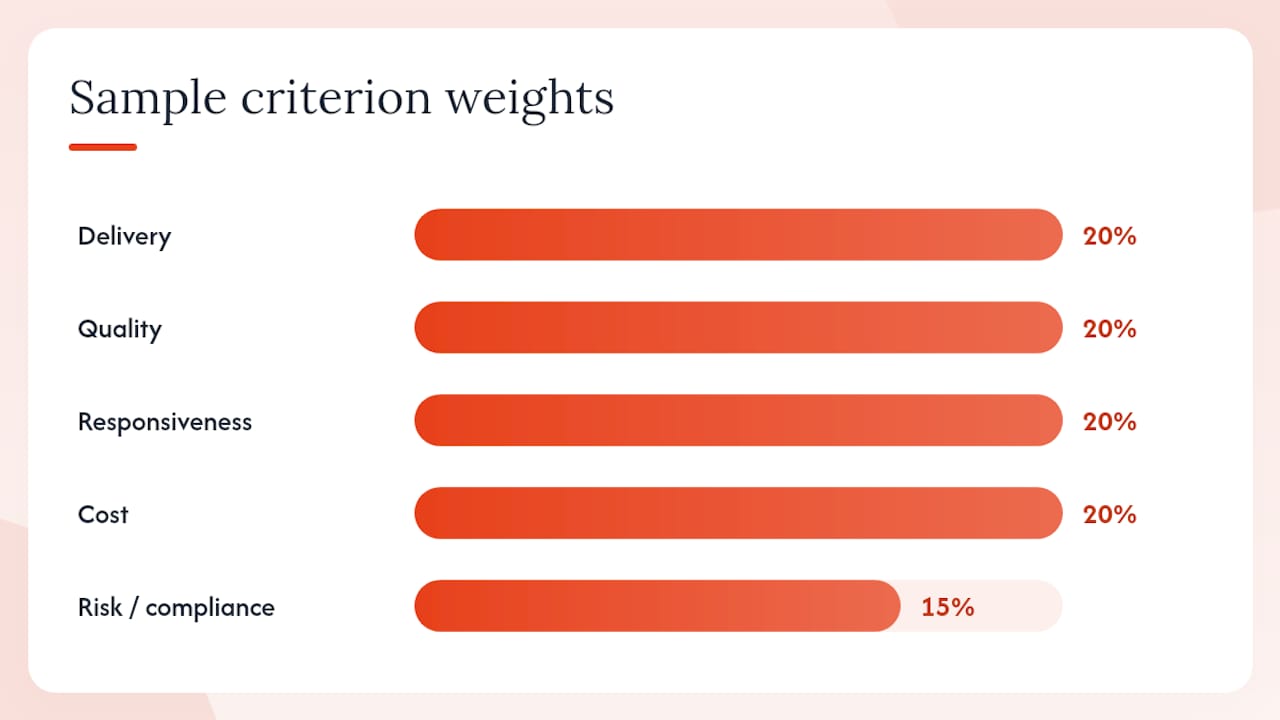
Sample weighting table (based on AppDeck's default weight guidance):
| Criterion | Weight | Rationale |
|---|---|---|
| Delivery | 20% | Directly impacts operations and customer commitments |
| Quality | 20% | Drives rework cost and downstream risk |
| Responsiveness | 20% | Affects issue resolution speed |
| Cost | 20% | Price stability and budget predictability |
| Risk / compliance | 15% | Regulatory exposure and supply continuity |
| Total | 100% |
Worked example: Vendor A scoring cycle
| Criterion | Weight | Raw value | Score (1–5) | Weighted score |
|---|---|---|---|---|
| Delivery | 20% | 94% on-time | 3 | 0.7 |
| Quality | 20% | 3% defect rate | 2 | 0.4 |
| Responsiveness | 20% | 3.25 hrs avg | 4 | 0.8 |
| Cost | 20% | +2% variance | 4 | 0.8 |
| Risk | 15% | Compliance score noted in percent | 3 | 0.45 |
| Total | 100% | 3.20 |
A score of 3.20 places Vendor A in the "Approved" tier. Anything below 2.5 triggers a Watchlist review; above 4.0 qualifies for preferred or strategic status.
Pro Tip: When KPIs use different scales (percentages, hours, dollar amounts), apply min-max normalization: (value − min) ÷ (max − min). This maps every metric to a 0–1 range before converting to your 1–5 rubric, preventing a single high-variance metric from distorting the total. Z-scores work better when you have a large vendor population and want to flag statistical outliers.
Diagrams.us's vendor evaluation scorecard template makes the same point about avoiding false precision: the scorecard's value is in structuring the conversation and capturing evidence, not in producing a decimal that pretends to be more accurate than the underlying data.
Where do you get the template, and how do you set it up?
The fastest way to start is with a pre-built template rather than building from scratch. Below are the assets and setup steps.
Download links:
- AppDeck's free vendor scorecard template (Word/Google Docs format, adaptable to Sheets)
- GoSourced's vendor scorecard Excel template (Excel and Google Sheets)
- MapTrack's vendor evaluation scorecard PDF (printable reference version)
- Diagrams.us filled sample scorecard (pre-filled example with decision notes)
For teams that prefer building in Excel, the RFP Excel template toolkit on Swarm-stack's blog covers named ranges, formula structures, and protection settings that apply directly to scorecard builds.
Installation and customization steps:
- Rename the file with a version tag:
VendorScorecard_CategoryName_v1.0_YYYY-MM.xlsx - Set your criteria and weights in the designated weight cells (confirm they sum to 100%).
- Add evidence link columns next to each scored criterion so reviewers can attach PO numbers, ticket IDs, or document URLs.
- Protect formula cells (weighted score column, total row) to prevent accidental overwrites.
- Add a "Change Log" tab: date, change description, changed by, version number.
- Share via a controlled folder (SharePoint, Google Drive) with reviewer-level access only.
Key formulas for automated weighted totals:
Weighted score per criterion: =B3*C3   (weight × raw score)
Total weighted score: =SUM(D3:D7)
Tier classification: =IF(D8>=4,"Strategic/Preferred",IF(D8>=3,"Approved",IF(D8>=2,"Watchlist","Exit Review")))
Pro Tip: Create a named range called WeightRange covering your weight cells. Reference it in your total formula so that when you add or remove criteria, the formula updates automatically without breaking.
Scorecards should be treated as living documents. AppDeck's template guidance recommends revisiting before contract renewal, after a pricing change, ownership change, or service failure, and storing dated copies so you build a decision history over time.
How do you turn a score into a concrete improvement plan?
A score that doesn't trigger an action is just a number. The remediation plan is what converts scorecard data into vendor improvement.
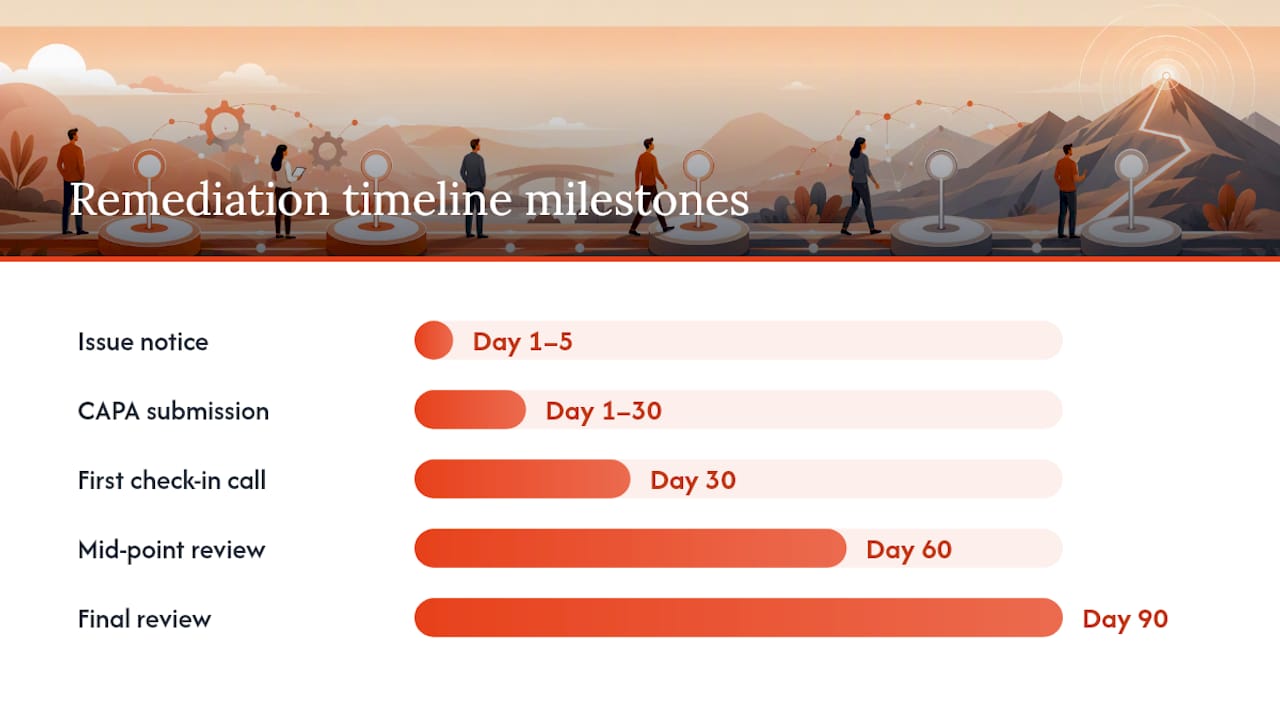
30/60/90-day remediation timeline:
- Day 1–5: Issue formal written notice to the vendor citing the specific KPIs below threshold, the current score, and the target score required to exit Watchlist status.
- Day 1–30: Vendor submits a root cause analysis and corrective action plan (CAPA) with named owners and measurable milestones.
- Day 30: First check-in call. Review CAPA progress against milestones. Document outcomes.
- Day 60: Mid-point review. Re-score the affected KPIs using current data. Confirm trajectory.
- Day 90: Final review. If the vendor has reached the target score, exit Watchlist and document the resolution. If not, escalate to contract levers.
QBR agenda template centered on scorecard trends:
- Scorecard summary: current score, tier, and trend vs. prior quarter (5 minutes)
- KPI deep-dive: review each criterion where score changed by more than 0.5 points (15 minutes)
- Open CAPA items: status update on each corrective action, owner confirmation (10 minutes)
- Upcoming contract milestones: renewal dates, pricing review windows, volume commitments (5 minutes)
- Joint priorities for next quarter: vendor's proposed improvements and procurement's expectations (10 minutes)
Contract levers tied to score thresholds:
- Score 3.0–3.9 (Approved): Standard terms apply. Flag any declining trend.
- Score 2.0–2.9 (Watchlist): Activate remediation plan. Pause new spend commitments. Apply service credits per contract terms.
- Score below 2.0 (Exit review): Invoke termination-for-cause provisions or begin dual-sourcing. Notify legal.
The termination vs. remediation decision hinges on two factors: how replaceable the vendor is and how quickly the score decline happened. A strategic vendor with a single bad quarter and a credible CAPA deserves the 90-day process. A routine vendor with a two-year declining trend and no response to prior notices does not.
What governance controls make scorecards auditable and defensible?
Governance is what separates a scorecard that holds up in a contract dispute from one that gets dismissed as a subjective exercise.
Governance checklist:
- Version every scorecard file with a date stamp and version number before each scoring cycle.
- Require two or more independent reviewers per vendor; document each reviewer's scores before the moderation session.
- Retain evidence for each scored criterion: PO numbers, ticket IDs, quality reports, or contract compliance certificates.
- Store completed scorecards in a controlled folder with access logs for at least three years (or per your organization's document retention policy).
- Conduct an annual calibration session where reviewers score the same vendor independently and compare results to reduce inter-reviewer drift.
- Separate internal-only fields (risk notes, legal flags, exit considerations) from the vendor-facing performance summary shared at QBRs.
Acceptable evidence by KPI:
| KPI | Acceptable evidence |
|---|---|
| On-time delivery | ERP delivery report with PO reference numbers |
| Defect rate | Quality inspection report, return authorization records |
| Invoice accuracy | AP dispute log, matched invoice report |
| Response time | Ticketing system export with timestamps |
| Compliance score | Audit certificate, completed compliance checklist |
Pro Tip: Run a 30-minute calibration session at the start of every new scoring cycle. Have each reviewer score one reference vendor independently, then compare. If scores diverge by more than one point on any criterion, discuss the rubric anchor until the team reaches consensus. This single step cuts inter-reviewer variance faster than any written instruction.
Change management is where most scorecard programs stall. Reviewers who don't understand why they're scoring or what happens to the data will score inconsistently or stop participating. A one-hour onboarding session covering the rubric, the evidence requirements, and what happens when a vendor hits Watchlist is enough to align most teams. Pair it with a shared FAQ document and a named point of contact for scoring questions.
Info-Tech's vendor evaluation scorecard guidance is explicit on this: scorecards require moderation and calibration to function as intended. The tool doesn't replace judgment; it structures it.
What are the most common scorecard mistakes, and how do you avoid them?
The pitfalls that kill scorecard programs:
- Too many criteria: A 15-criterion scorecard takes twice as long to complete and produces half the adoption. Keep it to 4–6 core metrics for most vendors. Add criteria only when you have a reliable data source for them.
- Inconsistent reviewers: Rotating who scores each cycle introduces variance that makes trend data meaningless. Assign a fixed reviewer pool per category and keep it stable.
- Price dominating the score: When cost gets a 40% weight because it's the easiest metric to measure, the scorecard stops reflecting actual vendor value. Weight criteria by business impact, not data availability.
- No evidence attached: A score without supporting evidence is an opinion. Require at least one evidence reference per criterion before a scorecard is considered complete.
- Watchlist with no follow-up: Flagging a vendor as Watchlist and taking no action within 30 days signals to the team that the scorecard doesn't matter. Tie Watchlist status to an automatic remediation task.
- Scoring vendors that fail basic requirements: Run a pre-screen before scoring. If a vendor can't meet minimum security, integration, or pricing requirements, remove them from the scoring pool. Diagrams.us's template recommends checking these gates before applying weighted criteria to avoid false precision.
Quick validation checklist before you launch:
- Do all weights sum to 100%?
- Does every criterion have a written rubric anchor for each score level?
- Is there a named data source for every KPI?
- Has the reviewer pool been confirmed and trained?
- Is there a defined action for each score tier (Preferred, Approved, Watchlist, Exit)?
- Is there a scheduled date for the first scoring cycle?
If you can answer yes to all six, the scorecard will be used. If not, fix the gaps before rolling out.
Key Takeaways
A vendor evaluation scorecard works when it combines defined KPIs, written rubric anchors, consistent reviewers, and a clear action protocol for every score tier.
| Point | Details |
|---|---|
| Keep criteria tight | Limit scorecards to 4–6 core KPIs; add metrics only when a reliable data source exists. |
| Weight by business impact | Default weights (Delivery 20%, Quality 20%, Responsiveness 20%, Cost 20%, Risk 15%) should shift based on Kraljic quadrant and category risk. |
| Evidence is non-negotiable | Every scored criterion needs a documented source (PO report, ticket export, audit certificate) before the cycle closes. |
| Tie scores to actions | Watchlist status must trigger a 30/60/90-day remediation plan within five days; a score with no follow-up is just a number. |
| Swarm-stack accelerates rollout | Swarm-stack's collaborative sessions, versioning, and export features reduce the time from pilot to enterprise scorecard cadence. |
The gap between what scorecards promise and what actually derails them
Most procurement teams that struggle with scorecards aren't failing on the math. The weighted totals are fine. The rubric anchors are reasonable. What breaks down is the human layer: the calibration session that never gets scheduled, the reviewer who scores from memory instead of evidence, the Watchlist vendor that stays on Watchlist for three quarters because nobody wants the conversation.
The conventional wisdom says the hard part is building the scorecard. It isn't. The hard part is the first time you hand a vendor a score of 2.1 and tell them they have 90 days to fix it. That conversation requires organizational backing, documented evidence, and a clear contract lever. Without all three, the scorecard becomes a document that lives in a shared drive and gets updated once a year when someone remembers it exists.
There's also a subtler failure mode: teams that over-engineer the template before they've validated the data. A 12-criterion scorecard with automated ERP feeds sounds like a mature program. But if the defect rate data hasn't been cleaned in two years and the response time field is manually entered by whoever has time, the precision is cosmetic. Start with three metrics you can actually measure consistently, run two cycles, and add complexity only when the foundation is solid.
The other thing most guides skip: share the scorecard with the vendor. Not the internal-only risk notes, but the performance summary. Vendors who see their scores improve faster than vendors who receive only a remediation letter. Transparency creates accountability on both sides, and it changes the QBR from a performance review into a working session.
Swarm-stack makes scorecard collaboration faster and more defensible
Procurement teams that run scorecards across multiple categories and reviewers hit a familiar problem: version sprawl, inconsistent evidence capture, and calibration sessions that produce no documented output. Swarm-stack addresses that directly.
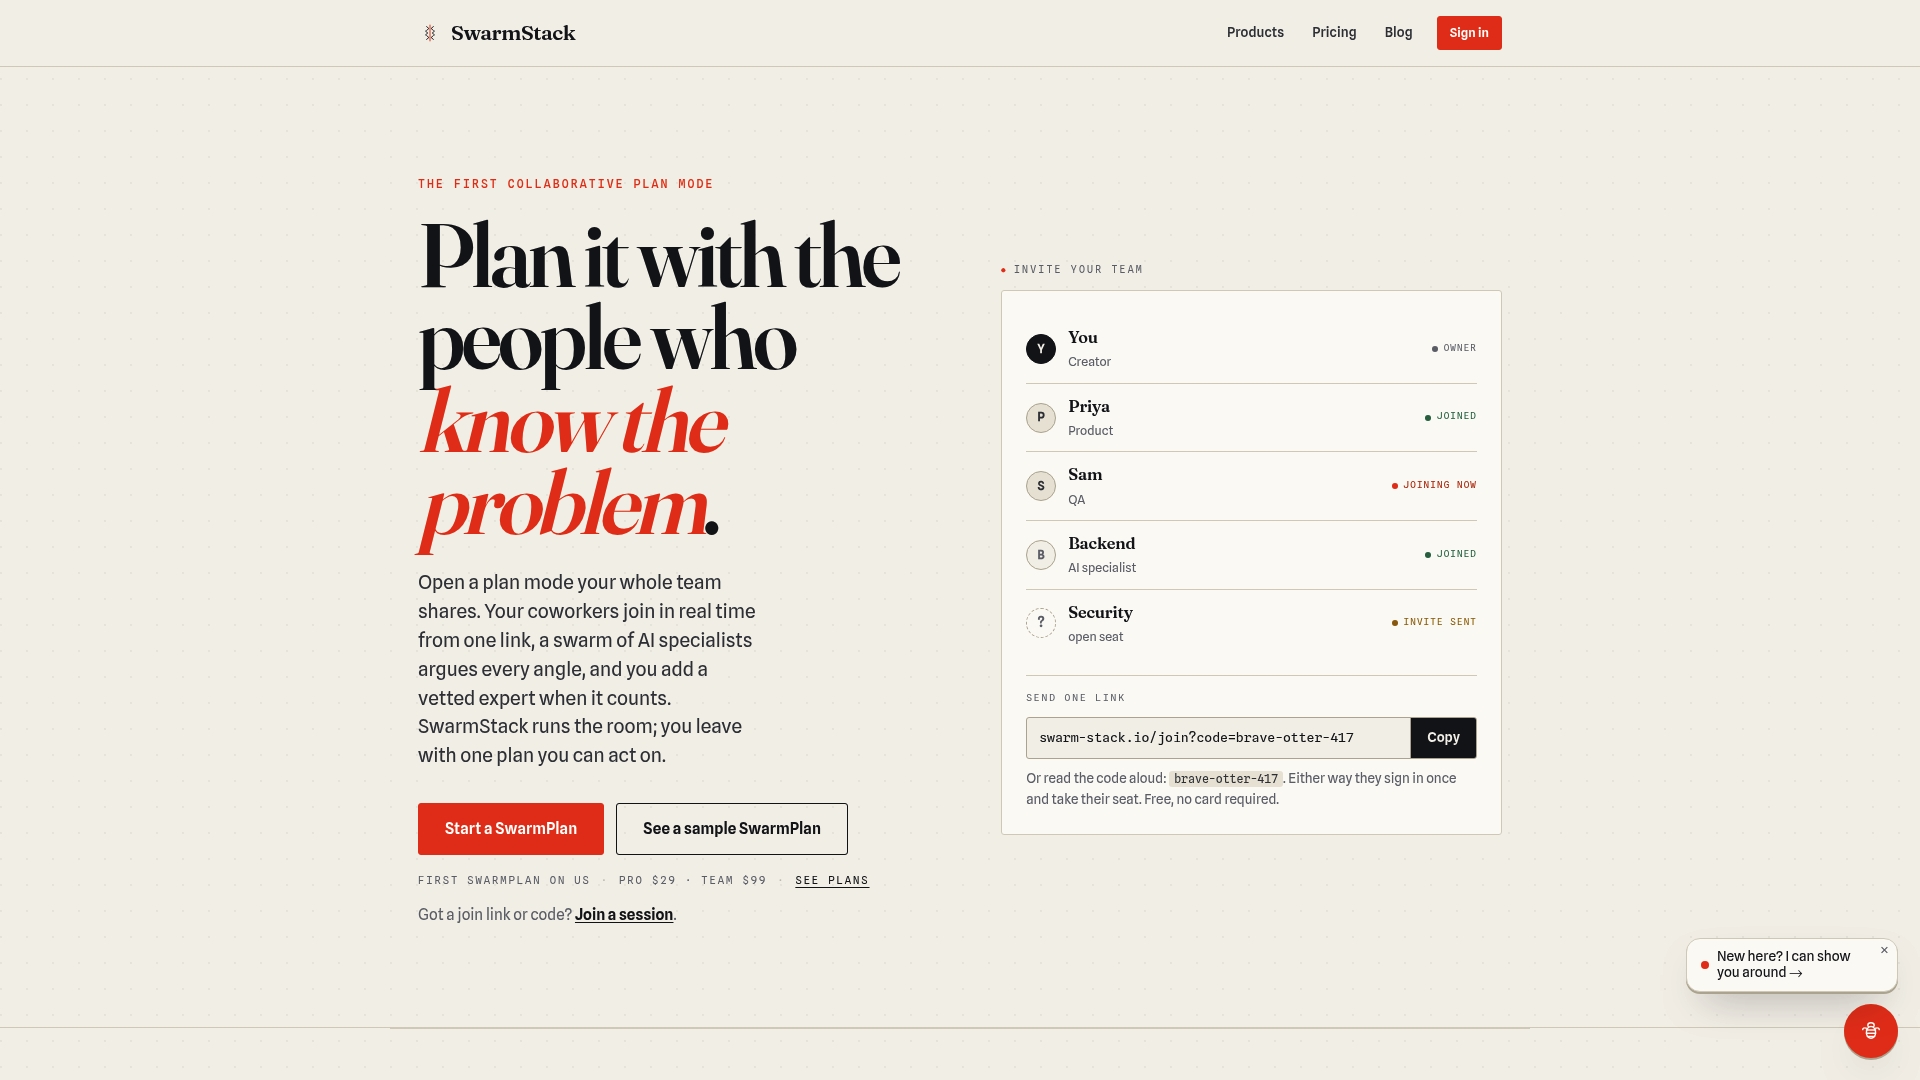
Through structured real-time sessions, Swarm-stack lets your reviewer pool score vendors collaboratively, with AI specialists and human experts contributing to the same deliverable simultaneously. Every session produces a versioned output with a full decision history, so your scorecard isn't just a file — it's a documented record of who scored what and why. Completed scorecards export directly to Google Sheets, CSV, or BI tools, so your existing dashboards stay current without manual re-entry. Reviewers join via a single invite link; no platform training required. For teams managing cybersecurity vendor evaluations or complex strategic procurement RFPs, the collaborative versioning and argument-driven refinement cut calibration time significantly.
Start a trial at swarm-stack.io and run your first collaborative scoring session this week.
Authoritative sources and where to read next
The following sources informed this guide's KPI definitions, template structures, deployment timelines, and governance recommendations.
- Vendor Evaluation Scorecard | Info-Tech Research Group
- Free Vendor Scorecard Template (Word) | AppDeck
- Vendor Scorecard Template: How to Evaluate and Track Supplier Performance
- Vendor Evaluation Scorecard Template
- Free Vendor Evaluation Scorecard Template (PDF)
- Quantify how much time your company wastes | HBR
- How to build a vendor scorecard for procurement excellence
- The cost of interruptions: they waste more time than you think | NPR